/Announcing the Q4 Performance Dashboard

Announcing the Q4 Performance Dashboard
Shopify did something amazing last year—they created a live dashboard for Black Friday, showcasing the sheer scale of what their sellers can achieve in a single day.
As Amazon sellers, we know it’s not just Black Friday or Cyber Monday that make Q4 exceptional; it’s the entire season.
Q4 is the Super Bowl for sellers—the time of year when you’re likely to do over 70% of your annual sales in a single quarter. But what if you could track your exact performance during this crucial time and see how you rank against other sellers?
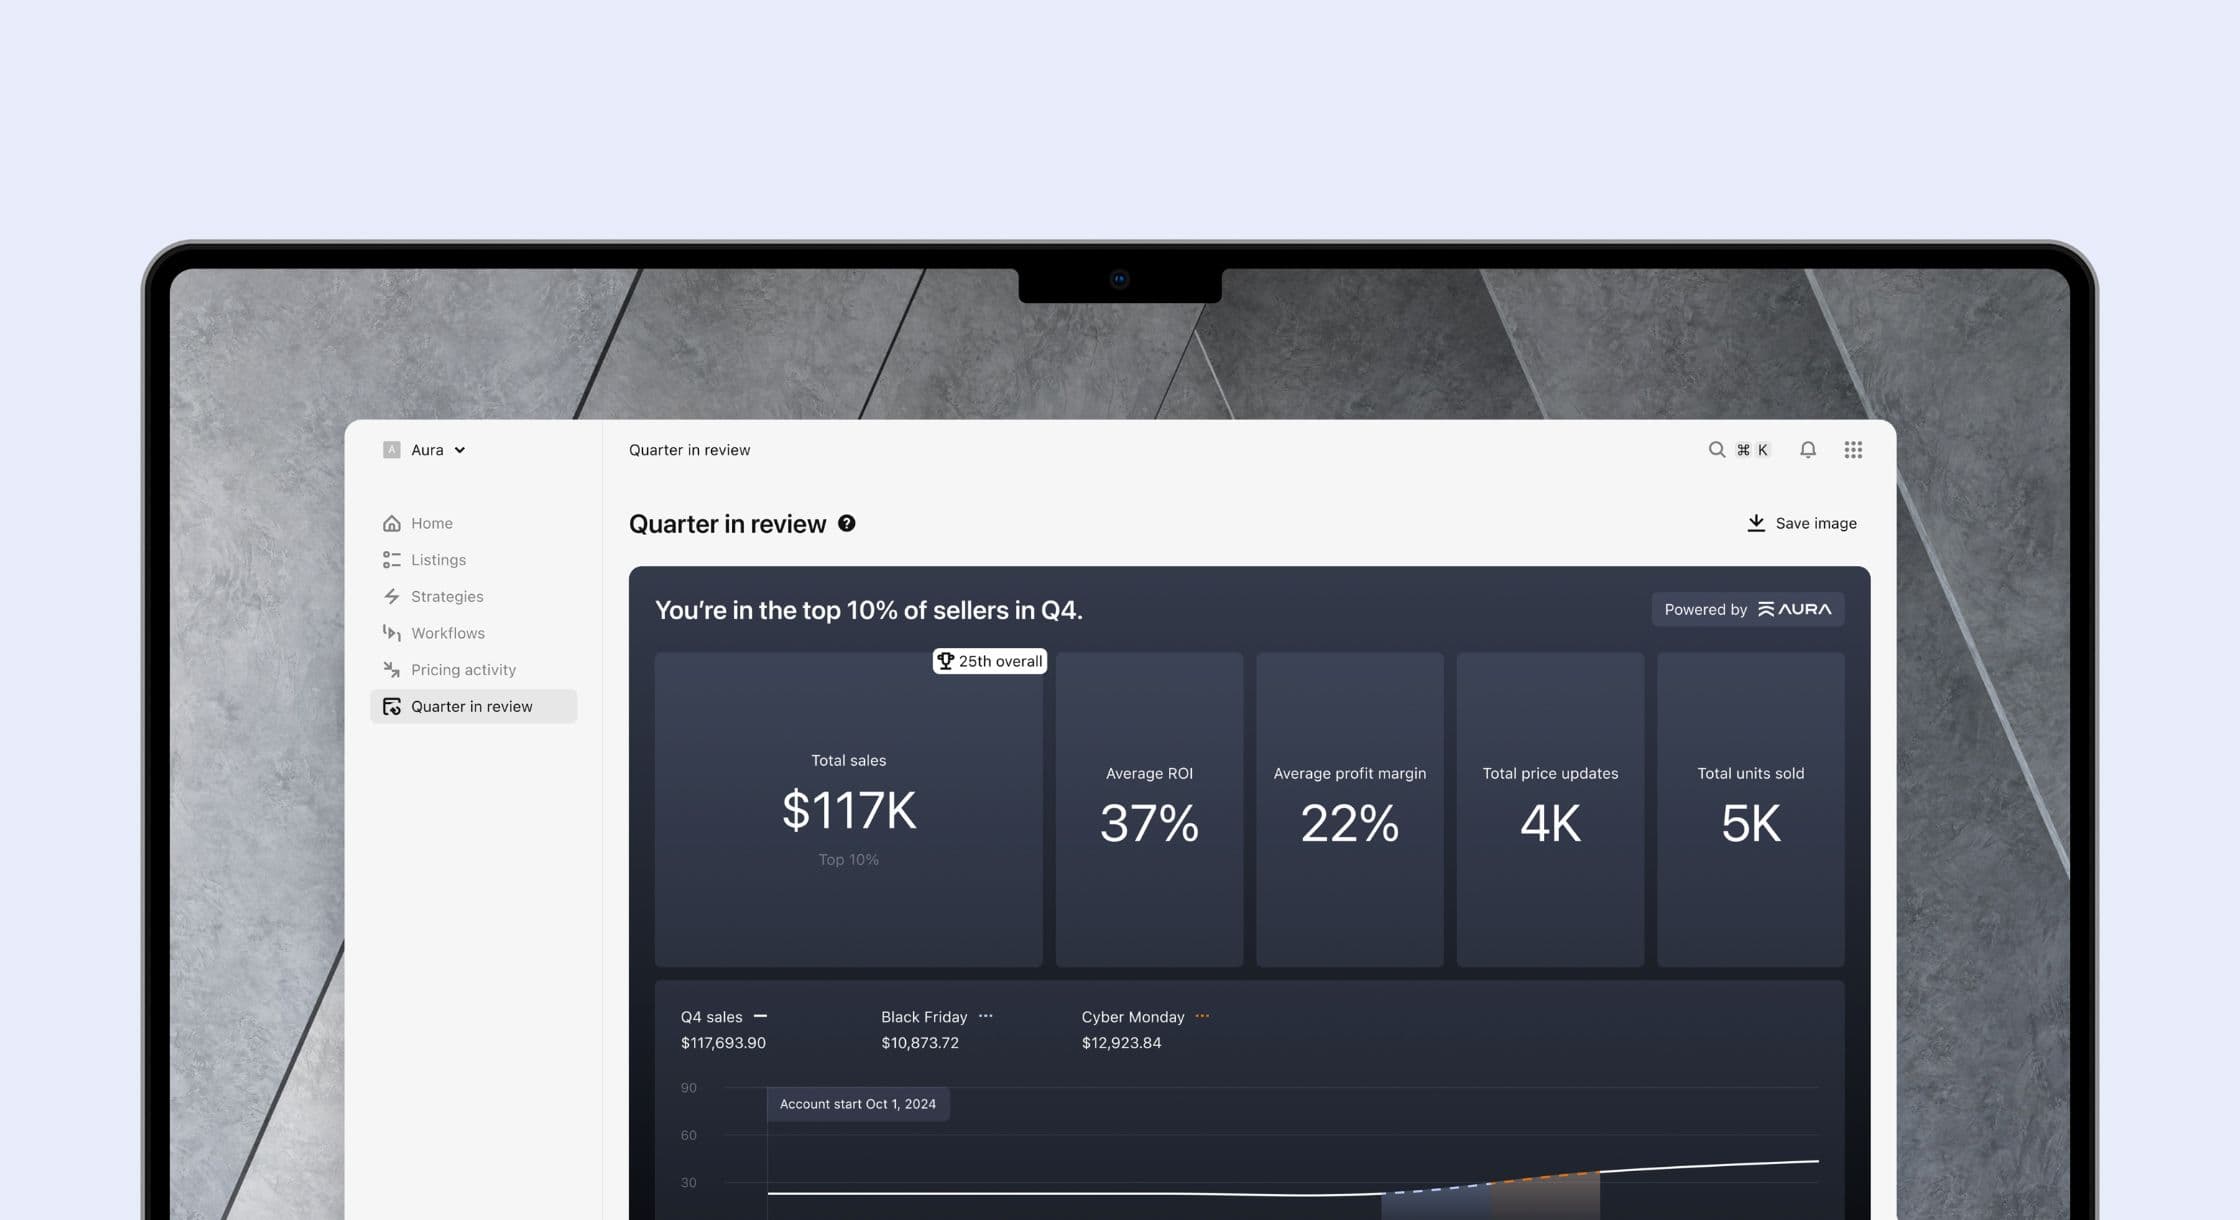
Inspired by what Shopify did for ecommerce, we thought about how incredible it would be to have access to this kind of data as sellers. So, our team came together to create something unprecedented in the Amazon space. Today, we’re excited to introduce the Q4 Performance Dashboard for every Aura user.
This new dashboard lets you see not only how you’re performing throughout Q4 but also how you rank against other Aura users. No more guessing—just real data.
You’ll be able to track the following metrics:
- Aggregate sales
- Average ROI
- Average Profit Margin
- Total price updates
- Aggregate units sold
- Sales on Black Friday
- Sales on Cyber Monday
To make it even more fun and competitive, we’ve made it easy for you to download your dashboard and share it on social media. Let the bragging rights begin!


